Now that you’ve learned how the sales team works with Leads, Campaigns, and Opportunities in Salesforce, it’s time to see how Salesforce supports their supervisors. Forecasts is a tool or set of tools that allows sales management to track and analyze current sales progress and results. It provides valuable information related to the current state of sales, allowing you to view them by team or individual salesperson. To access Forecasts, there’s a dedicated tab in the Salesforce interface and specific permissions are required. However, before you can view anything in Forecasts, it needs to be configured (you can do this in Setup). We won’t go into detail on how to do this because the Forecasts functionality has many possibilities and it’s difficult to describe a universal solution that will work for everyone. Just keep in mind that Forecasts are based on Opportunities, meaning that records of these objects are taken into account in Forecasts reports. You can track specific products on Opportunities, as well as setups that track Opportunity amounts. It’s possible to consider Opportunity Splits, which are margins divided among sales participants. To complement this reporting, you can also set targets or Forecast quotas for each salesperson with an account in Salesforce. This allows sales management to track the current sales status versus plans and targets for each salesperson. Forecasts is indeed a very interesting feature from Salesforce, offering significant configuration possibilities. Interestingly, the interface of this functionality has recently undergone a major refresh and now looks much better than it did some time ago. Let’s discuss the individual elements of this new, refreshed user interface, using the example of a salesperson, who, surprise, surprise, is me!
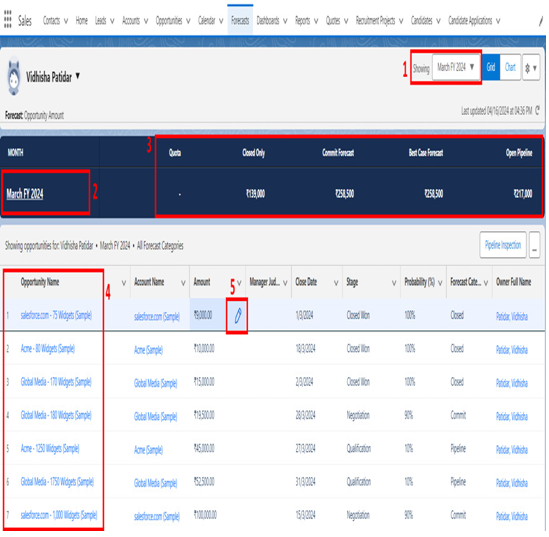
Figure 11.31: Salesforce Forecast user interface
As you can see in the preceding screenshot, Salesforce Forecasts provides a lot of valuable information. I have described the Forecasts view features as follows. Each number corresponds to the number provided in the preceding screenshot:
- You can set the Forecast Range setting, which clearly indicates what is displayed on the page. If you want to change the range, simply select the Showing field to opt for a different range.
- The current period is displayed in the summary view. You can change it.
- Refreshed icons simplify page navigation, and highlighting shows the data as progress bars, clearly indicating sales numbers versus specific targets. You can also see calculations on how much is missing and the numbers related to Opportunities that can be closed soon, as they are in the advanced sales phases categorized as commit or best case (you can define them when setting up Opportunity stages). Of course, you can also hover over each highlight to click and see additional details.
- On this list, you can see the Opportunity records related to the highlights used previously, so you can see based on which Opportunities Salesforce shows data in the Forecasts.
- You can make changes to individual Opportunities by editing data such as Opportunity amount, close date, or stage.
Thanks to the described solutions, Forecasts is not only a static reporting tool but can also be actively used during 1:1 meetings of sales managers with members of the sales team, during which they can discuss the current sales situation of a given salesperson and make live changes if necessary. As you can see, Salesforce Forecasting is not just a simple report but a whole module that, when configured correctly (according to the requirements of your sales department) and used regularly, can provide valuable information for sales management, allowing them to have ongoing control over sales processes, the stages at which individual salespeople are, and the entire team (or teams) versus the plan imposed on them. Presented information can contribute to even better results for the sales department and, above all, allow for real planning of the next sales challenges.